BioPeek
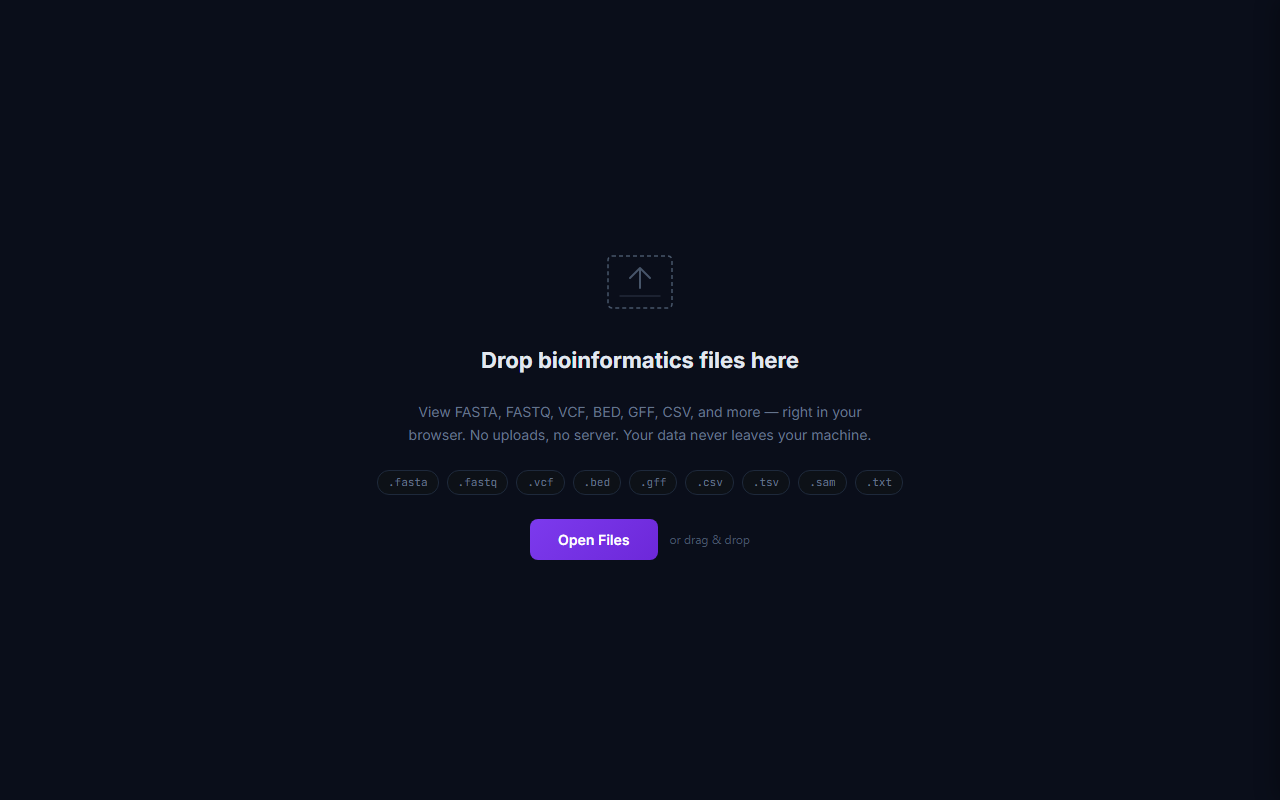
BioPeek is a client-side bioinformatics file viewer. Drop FASTA, FASTQ, VCF, BED, GFF, CSV, TSV, or SAM files into your browser for instant parsing, statistics, and analysis. Your data never leaves your machine — everything runs 100% in the browser.
Available as a standalone web app (installable as PWA), a Chrome extension, and embeddable in any website.
Feature Tour
~1 minute tour of key features
Supported Formats
| Format | Extensions | Auto-detected by |
|---|---|---|
| FASTA | .fasta, .fa, .fna, .faa | ">" header lines |
| FASTQ | .fastq, .fq | "@" header + quality lines |
| VCF | .vcf | ##fileformat=VCF header |
| BED | .bed | Tab-separated, 3+ columns, chrom/start/end |
| GFF/GTF | .gff, .gff3, .gtf | Tab-separated with "##gff" or 9 columns |
| SAM | .sam | Tab-separated with @HD/@SQ headers |
| CSV/TSV | .csv, .tsv | Comma or tab delimited |
Supported Formats Gallery

View Modes

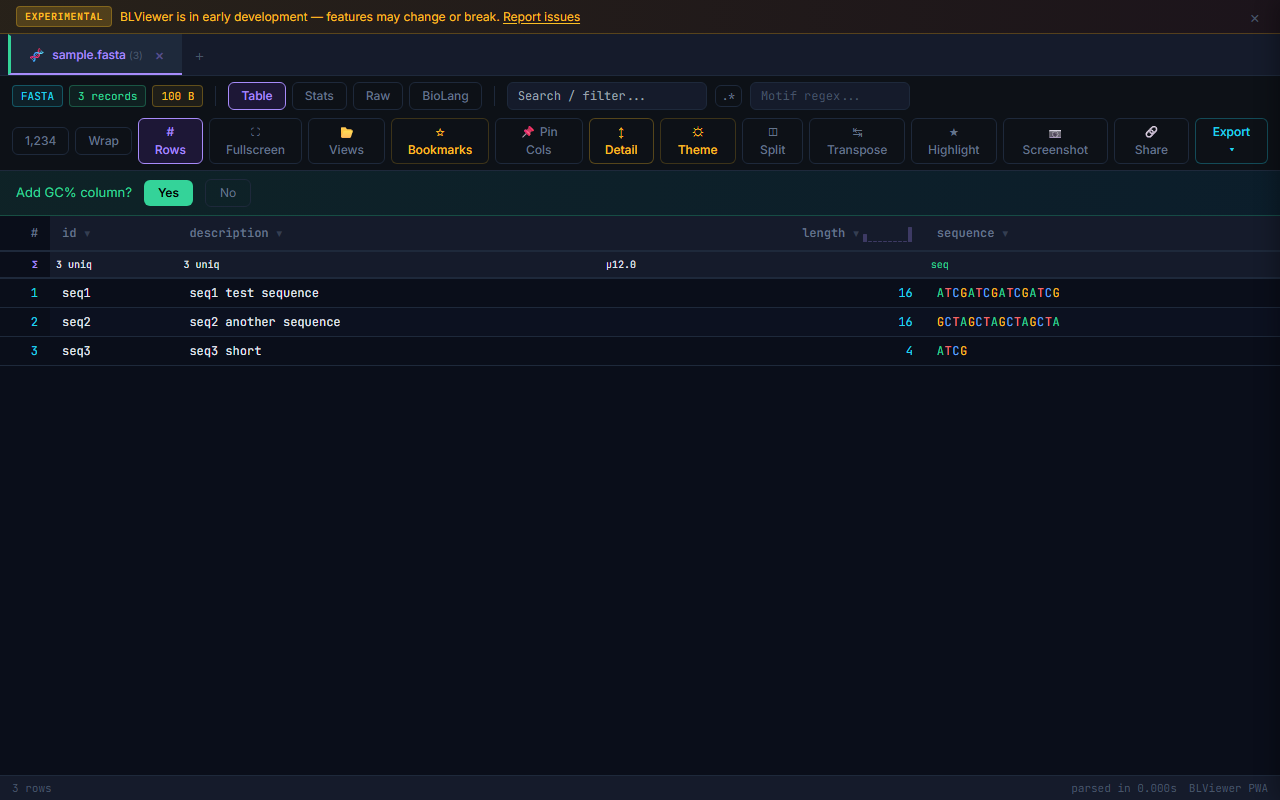
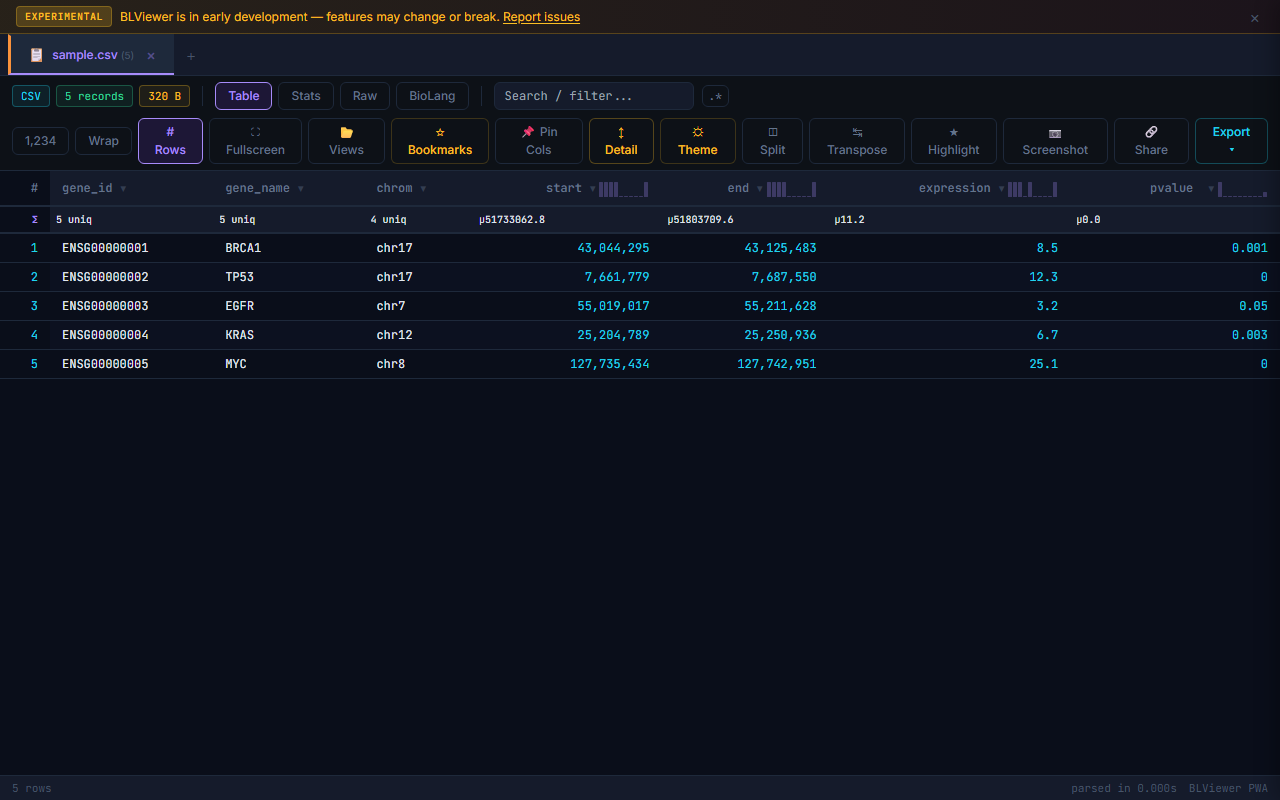
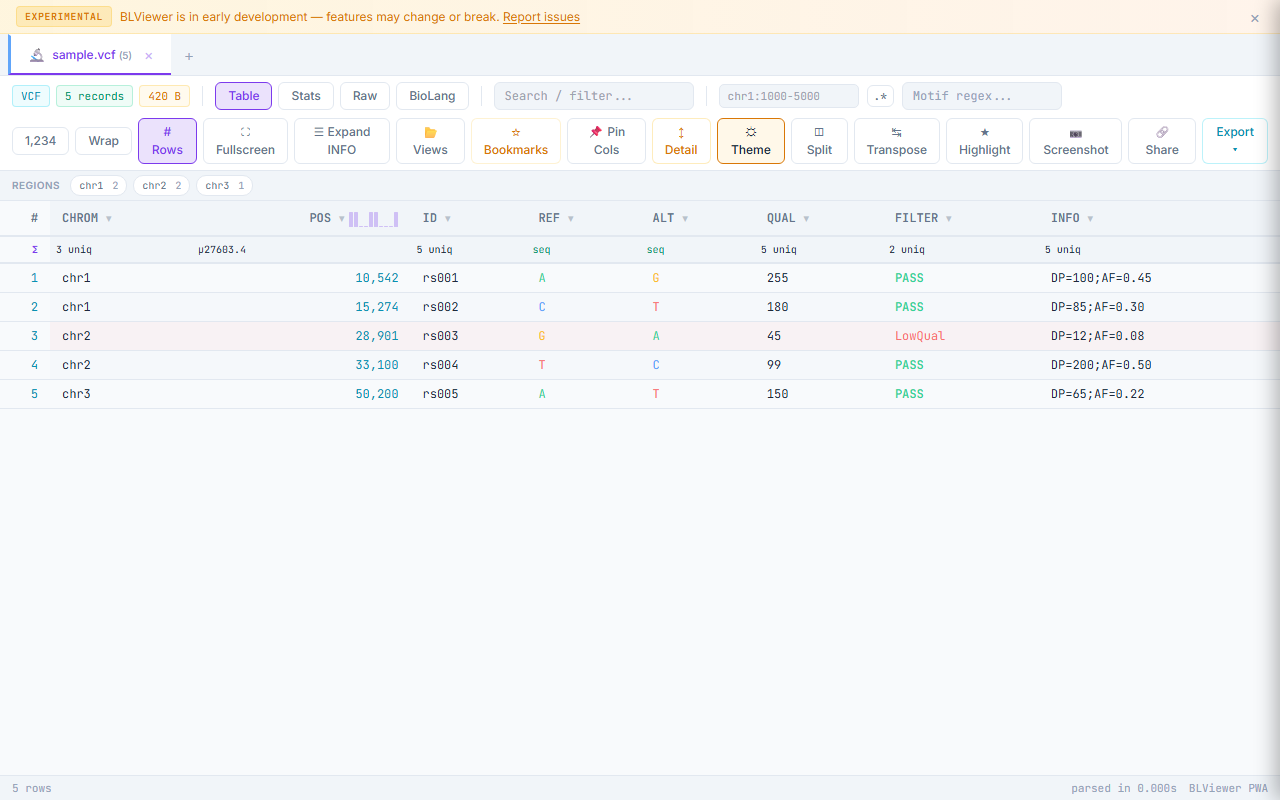
- Table (press 1) — Sortable columns, colored nucleotide highlighting (A=green, T=red, G=amber, C=blue), row numbers, search/filter, anomaly highlighting
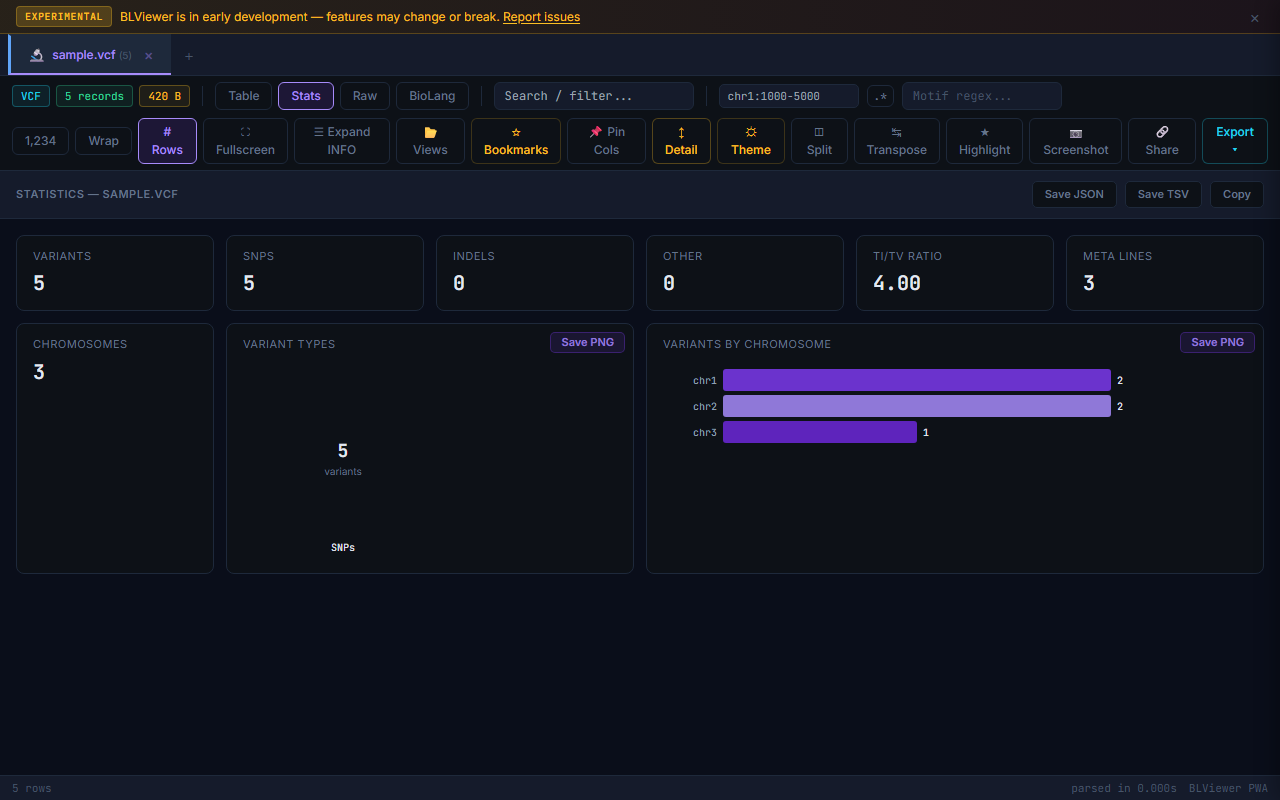
- Stats (press 2) — Format-specific statistics: sequence count, N50, GC% for FASTA; Q30%, mean quality for FASTQ; Ti/Tv ratio, SNP/indel breakdown for VCF; total coverage for BED. Each SVG chart has a download button. Export stats as JSON, TSV, or copy to clipboard.
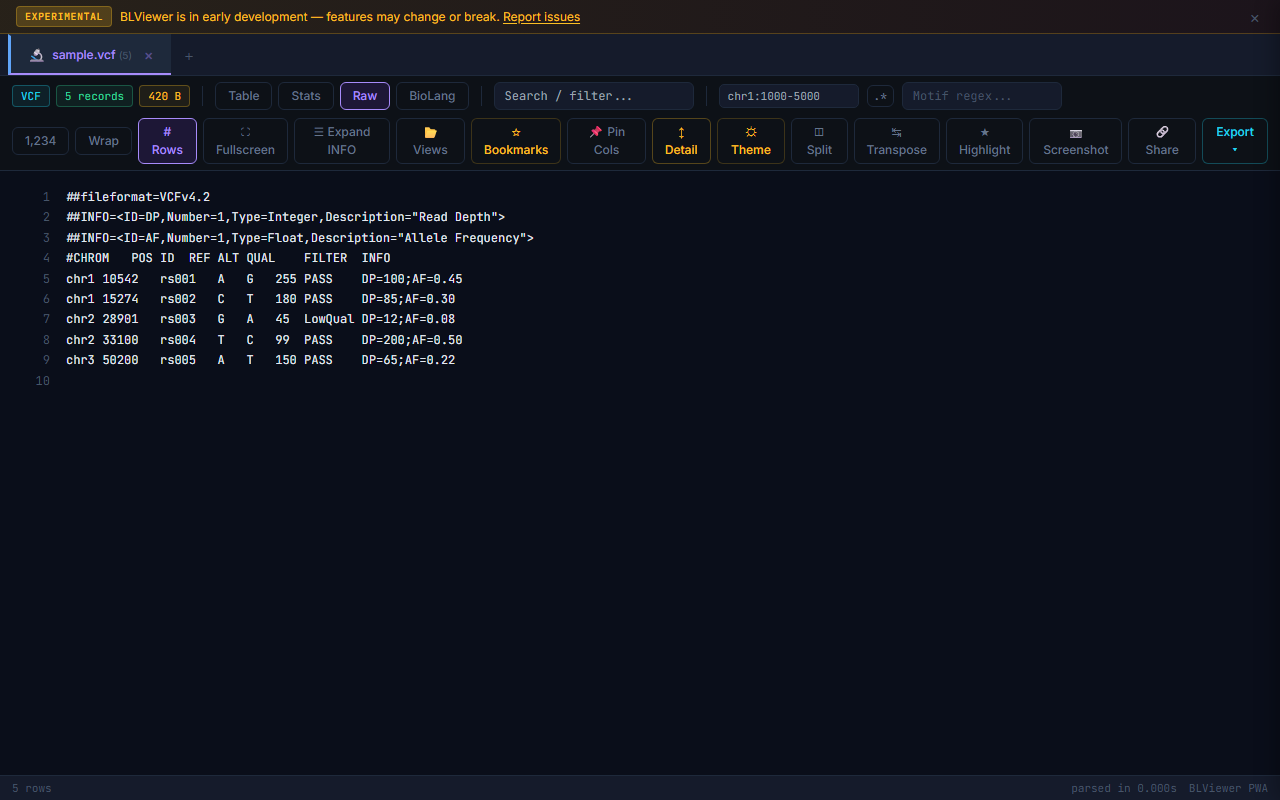
- Raw (press 3) — Line-numbered raw text view with search highlighting
- BioLang (press 4) — Interactive console with file pre-loaded as a
dataTable variable. Powered by WASM.
Toolbar Reference
| Button | Action |
|---|---|
| Toggle bookmark column — click stars to flag rows, click ★ header to export bookmarked rows | |
| Freeze first 2 columns when scrolling wide tables (6+ columns) | |
| Enable/disable row click detail panel (off by default, persists in localStorage) | |
| Side-by-side view: table on left, summary stats on right | |
| Compare rows between two open files of the same format (appears when 2+ same-format tabs open) | |
| Export current view as PNG image | |
| Generate a shareable URL with file data encoded (files < 100KB) | |
| Export as CSV, TSV, BED, VCF, HTML, or convert formats (VCF→BED, GFF→BED, FASTA→reverse complement) | |
| Toggle dark/light mode (persists in localStorage) | |
| Toggle transpose view — swap rows and columns (Ctrl+T) | |
| Show/hide the row numbers column | |
| Toggle word wrapping for long text cells | |
| Toggle fullscreen mode (F11) | |
| Toggle find & replace bar next to search box | |
| Show keyboard shortcuts overlay |
Features
◫ Split View
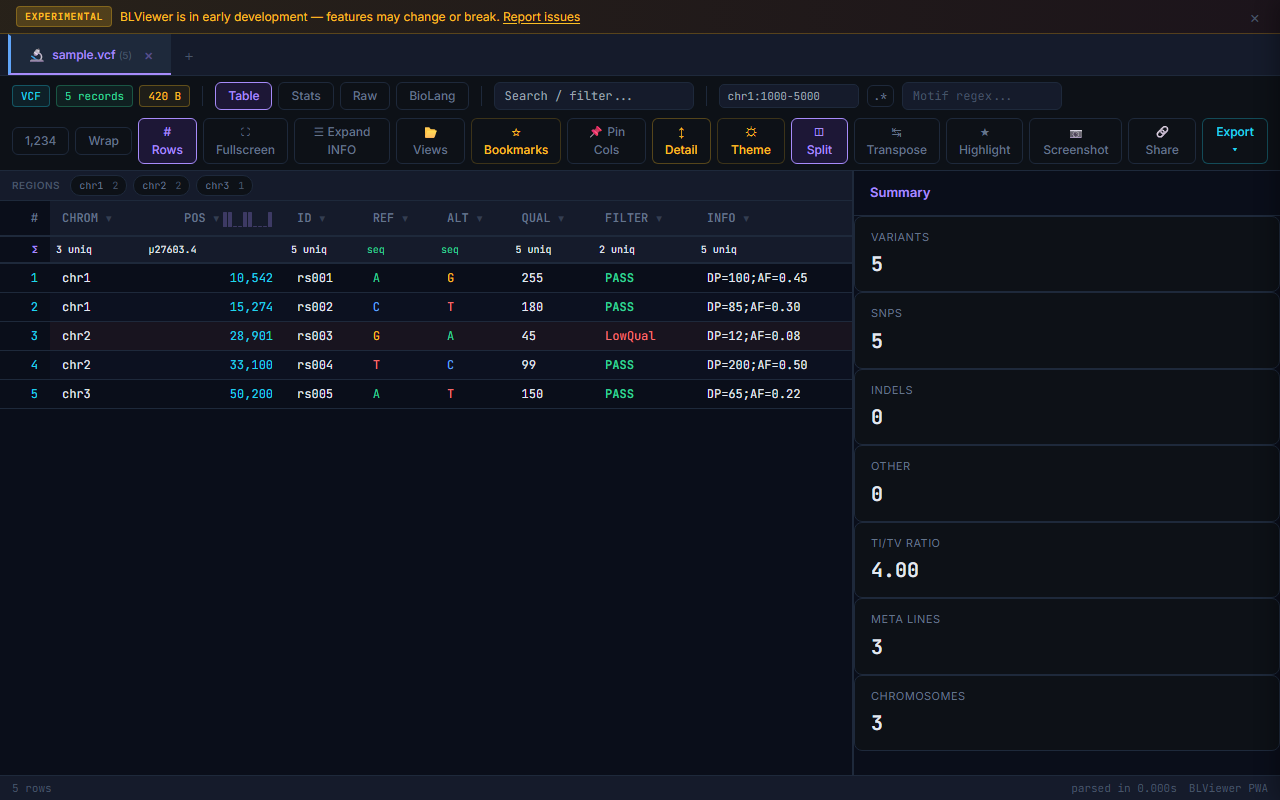
Click in the toolbar to display the table and stats side by side. The table takes 2/3 width, with a summary panel on the right showing all computed statistics for the current file.
≠ Diff — Compare Two Files
When two or more files of the same format are open, the button appears. Click it to compare rows between the active file and the next same-format tab. Rows are matched by natural keys:
- VCF: CHROM:POS:REF>ALT
- BED: CHROM:START-END
- FASTA/FASTQ: Sequence ID
- Other: Entire row as key
🔗 Shareable Links
Click to generate a URL with the file data encoded directly in the link. Anyone who opens the link sees the file instantly — no server, no upload.
lang.bio/viewer.html).
If you run BioPeek locally (file:// or localhost), the generated URL points to your local machine and cannot be opened by others.
The Chrome extension also cannot generate working share links.
| Deployment | Share works? | Why |
|---|---|---|
| lang.bio/viewer | Yes | Public URL — anyone can open the link |
| your-domain.com/viewer | Yes | Any public deployment works |
| localhost:8080 | No | URL points to your machine only |
| file:///path/viewer.html | No | Local filesystem path |
| Chrome Extension | No | Extension pages have chrome-extension:// URLs |
File size limit: 100 KB (larger files would create URLs too long for browsers to handle).
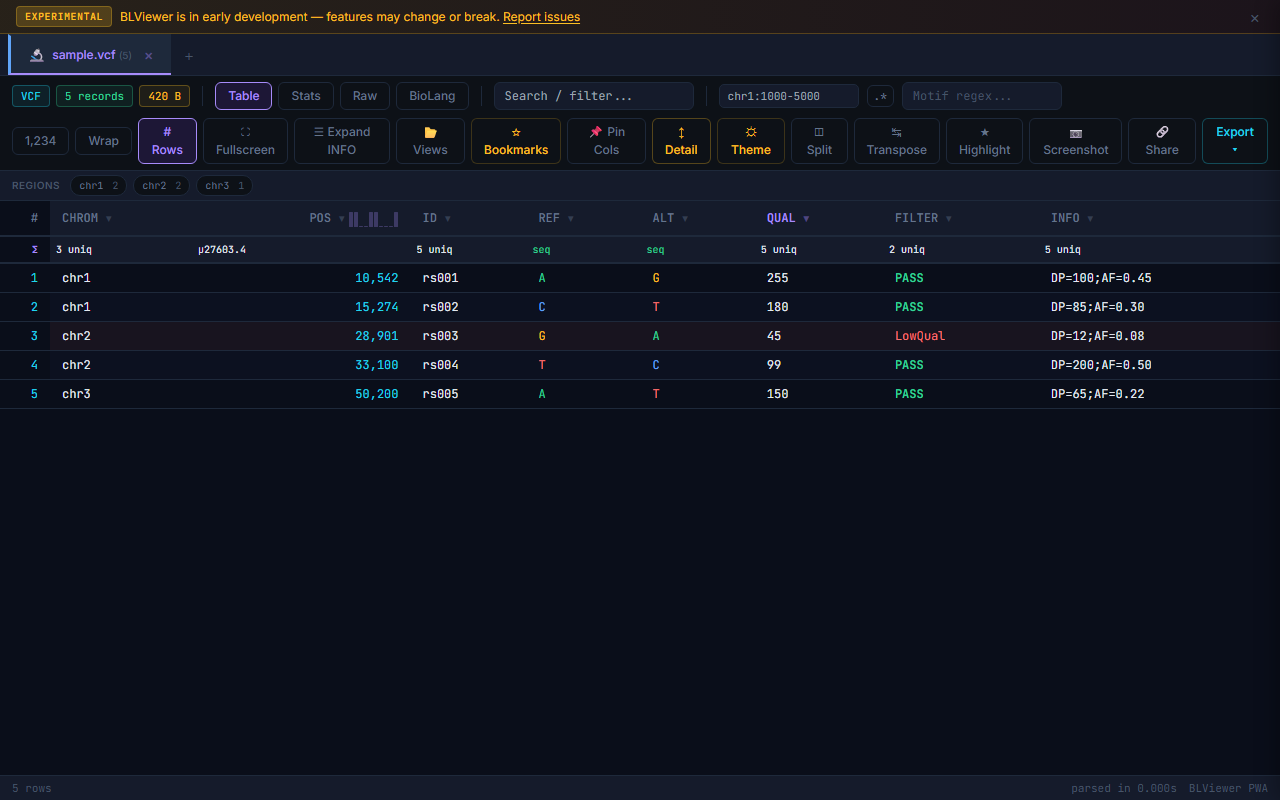
⚠ Anomaly Detection
BioPeek automatically scans files for common data quality issues and highlights affected rows with an amber left border. Hover over a highlighted row to see the anomaly description.
Checks performed per format:
| Format | Anomalies Detected |
|---|---|
| FASTA | Duplicate sequence IDs; unusually short or long sequences (IQR outliers) |
| FASTQ | Sequence/quality length mismatch |
| VCF | Duplicate variants (same CHROM:POS:REF>ALT); low QUAL (< 20) |
| BED | Start > End coordinates; negative coordinates |
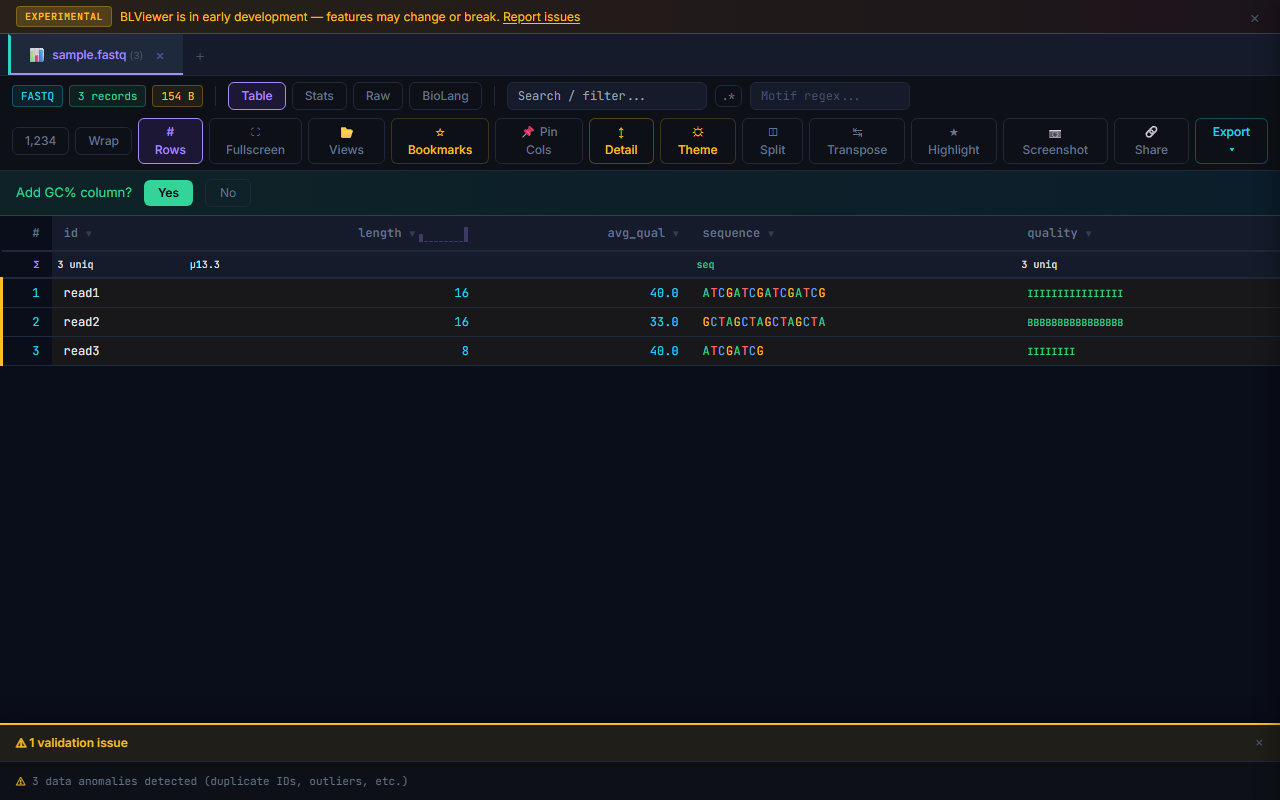
⚠ File Validation Report
When a file is loaded, BioPeek automatically checks for format-level issues (missing headers, wrong column counts, etc.) and shows a validation panel at the bottom if problems are found. This is separate from row-level anomaly detection.
Column Histogram Sidebar
Double-click any column header to open a sidebar showing statistics and a histogram for that column. Numeric columns show min, max, mean, median, and a bar chart distribution. Categorical columns show frequency counts for the top values.
Clipboard Paste & Smart Paste
Paste text directly into BioPeek with Ctrl+V. If the pasted text looks like bioinformatics data (starts with >, @, ##, etc.), it is auto-parsed as a new file tab named pasted-<timestamp>. Useful for quick inspection of sequences from papers or terminal output.
Smart paste auto-detects the format of pasted content. Raw nucleotide sequences without headers are wrapped as FASTA. Tab-delimited rows with chromosome columns are detected as BED. Comma-separated data becomes CSV. No manual format selection needed.
Sequence Selection Tools
Select any DNA/RNA text in the table and a popup appears with:
- Reverse complement — computed client-side
- GC content — percentage of G+C bases
- Codon translation — 3-frame translation to amino acids
- Copy buttons for each result
Sequence Motif Search
Search for DNA/RNA motifs across all sequence columns. Use IUPAC ambiguity codes (e.g., TATAWR for TATA box, CANNTG for E-box) or regex patterns. Matching positions are highlighted inline within sequence cells. The results panel shows match count and positions per sequence.
Codon Coloring for FASTA
FASTA sequence cells display codon-level coloring when a reading frame is selected. Each three-nucleotide codon is tinted by amino acid property: hydrophobic (amber), polar (cyan), positive (violet), negative (rose). Stop codons are marked in red. Toggle codon coloring from the column header context menu on sequence columns.
BLAST Search
Right-click any sequence cell (≥ 10 bp) and select "BLAST this sequence" to open NCBI BLAST in a new tab with the sequence pre-filled. Works with FASTA sequences and any column detected as a DNA/RNA sequence.
Format Conversion
The dropdown includes format conversion options based on the current file type:
| Source Format | Conversion Available |
|---|---|
| VCF | Convert to BED (CHROM, POS-1, POS, ID) |
| GFF | Convert to BED (CHROM, START, END, attributes) |
| FASTA | Reverse complement FASTA |
| All | Export as CSV or TSV (always available) |
📷 Screenshot Export
Click to export the current view as a PNG image. The screenshot includes file name, format, row count, column headers, and up to 30 rows of data. Stats view captures all computed statistics. Screenshots preserve ATCG nucleotide coloring (A=green, T=red, G=amber, C=blue), column auto-sizing, and the current theme (dark/light). The image downloads automatically as a PNG file.
Regex Capture Groups
Type a regex with capture groups (parentheses) in the search box. A floating panel appears showing all matches with extracted groups. Useful for pulling structured data out of free-text columns like VCF INFO or GFF attributes.
Example: searching gene_name "([^"]+)" in a GTF file extracts gene names into a results panel.
☼ Theme Toggle
Click the button in the toolbar to switch between dark and light mode. Your preference is persisted in localStorage and applied automatically on next visit. The theme also applies to screenshots and exported HTML.

Column Resize
Hover over the right edge of any column header to reveal a drag handle. Click and drag to resize the column width. The cursor changes to a resize indicator on hover. Column widths are remembered for the current session.
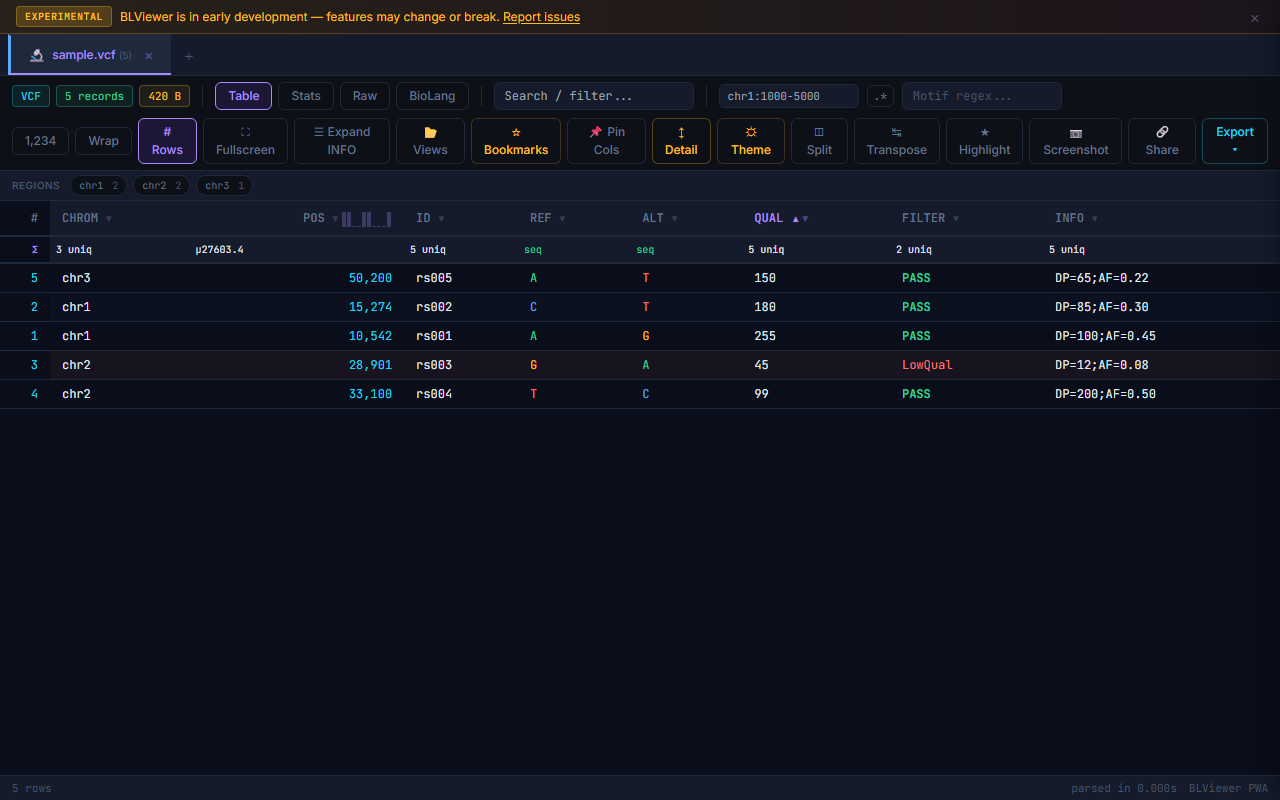
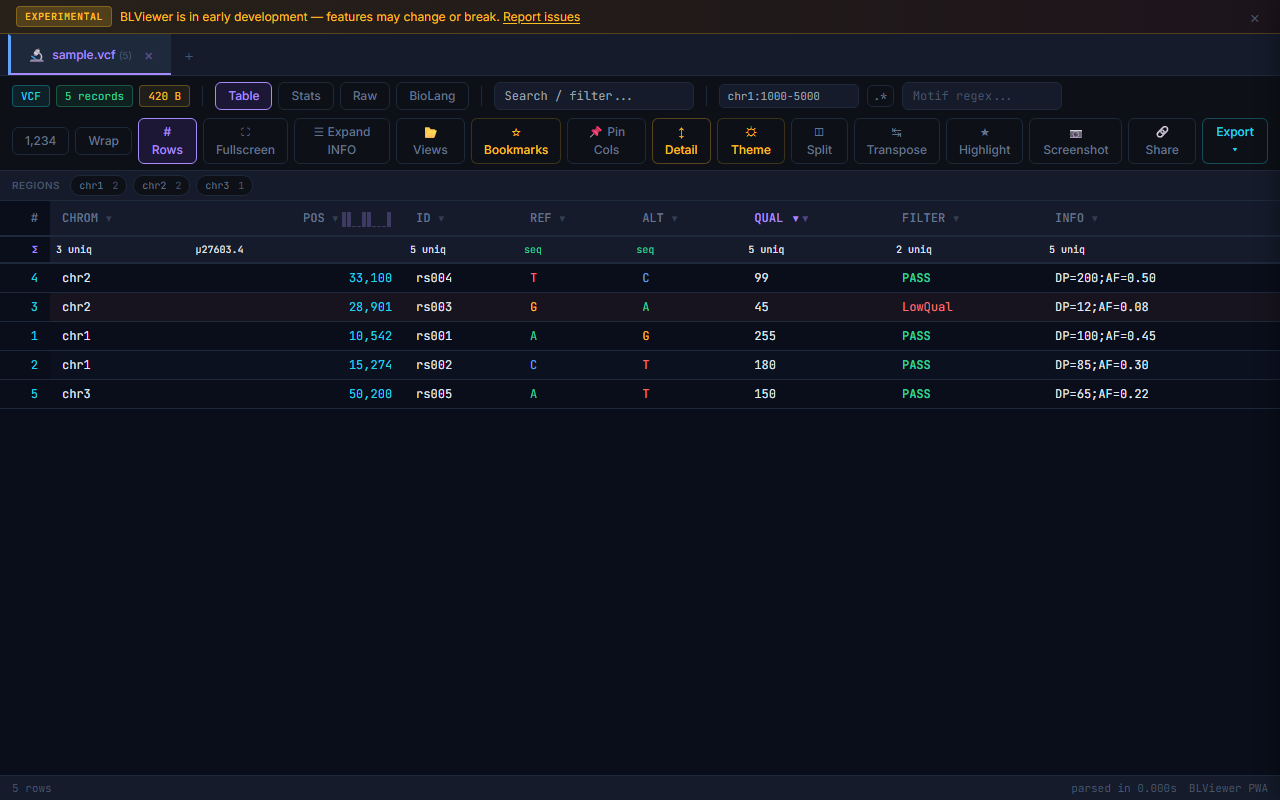
Sort Arrows
Active sort columns display visual indicators in the header: ▲ for ascending and ▼ for descending. The sorted column header is highlighted to make the current sort state immediately visible. Click a column header to cycle through: ascending → descending → unsorted.
📌 Pin Columns
Pin any column to keep it visible while scrolling horizontally. Right-click a column header and select Pin Column, or use the toolbar button to pin the first two columns. Pinned columns stay frozen on the left side of the table. You can pin multiple columns independently — not just the first two.
▾ Inline Column Filters
Each column header has a small filter icon (▾). Click it to open a dropdown showing all unique values in that column. Check or uncheck values to filter the table. Active filters show a highlighted filter icon. Multiple column filters combine with AND logic.
Row Count in Tabs
Each file tab displays a badge showing the number of rows in that file. This gives an at-a-glance size comparison when multiple files are open. The badge updates when filters are applied, showing filtered count vs total (e.g., 234 / 1,089).
Multi-Column Sort
Hold Shift and click additional column headers to sort by multiple columns. Each sorted column shows a priority number (①②③) indicating the sort order. The first-clicked column is the primary sort, second is secondary, and so on. Click a sorted column without Shift to reset to single-column sort.
Column Reorder
Drag any column header to rearrange the column order. A blue insertion indicator shows where the column will be placed. The reordered layout persists for the current session and is included when saving views.
💾 Saved Views
Save the current table configuration (sort order, filters, column order, pinned columns, column widths) as a named view. Views are stored in localStorage and can be restored later. Useful for switching between different analysis perspectives on the same file.
Selection Stats
Hold Ctrl and click rows to select multiple rows. The footer bar updates to show the count of selected rows. Use Space to toggle selection on the focused row. Selected rows can be exported as a subset via the Export menu.
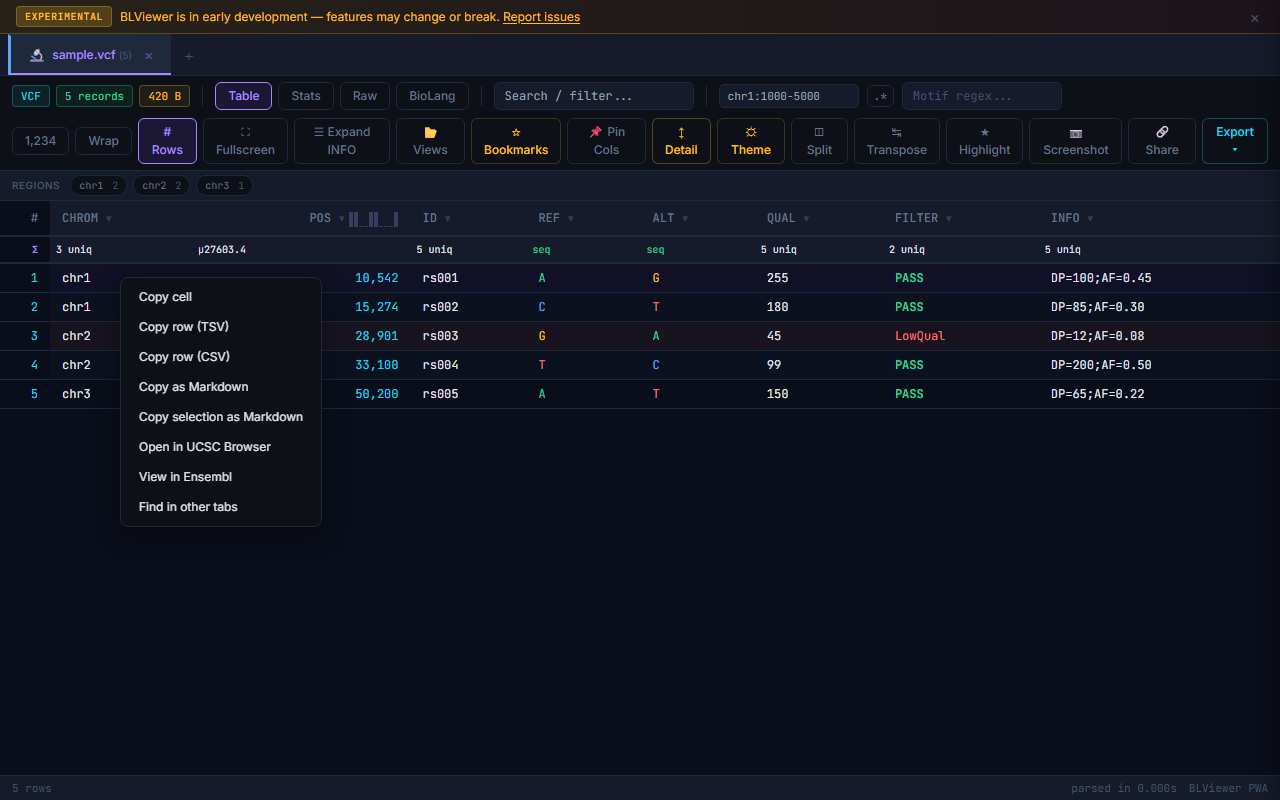
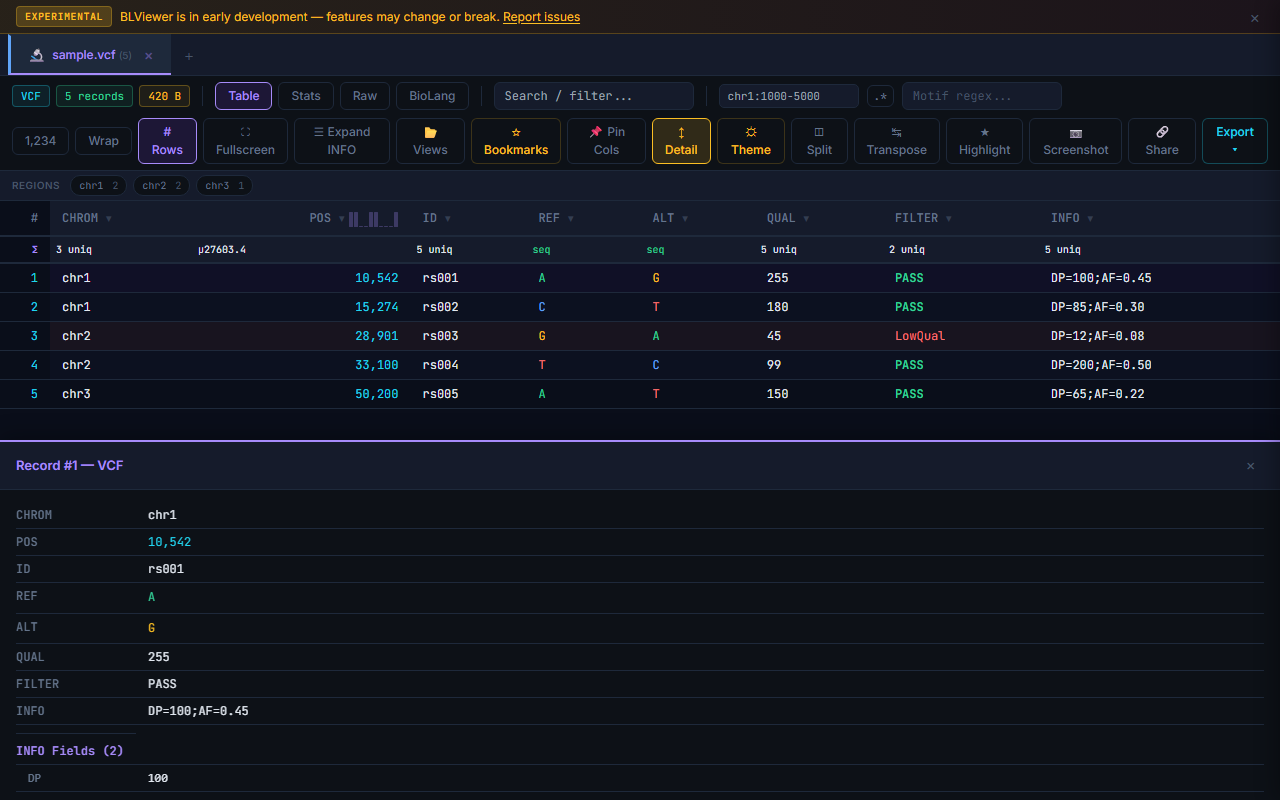
VCF INFO Parser
VCF INFO fields are automatically expanded into individual key=value pairs in the row detail panel. Click a row (with Detail toggle enabled) to see the full INFO field parsed into a readable list. Fields like DP=42;AF=0.5;MQ=60 become separate labeled entries.
Reverse Complement
Right-click any cell containing a DNA/RNA sequence and select Reverse Complement from the context menu. The reverse complement is computed client-side and can be copied to clipboard. Also available via the sequence selection popup (select text in a sequence cell).
GC% Auto-offer
When BioPeek detects a column containing DNA or RNA sequences, it automatically offers to compute GC content. A small GC% badge appears next to the column header. Click it to add a computed GC% column to the table. The GC percentage is calculated as (G+C) / (A+T+G+C) × 100.
Coordinate Jump
Press Ctrl+G to open the "Go to Row" dialog. Type a row number and press Enter to scroll directly to that row. Useful for navigating large files with thousands of rows.
Genomic Coordinate Navigation
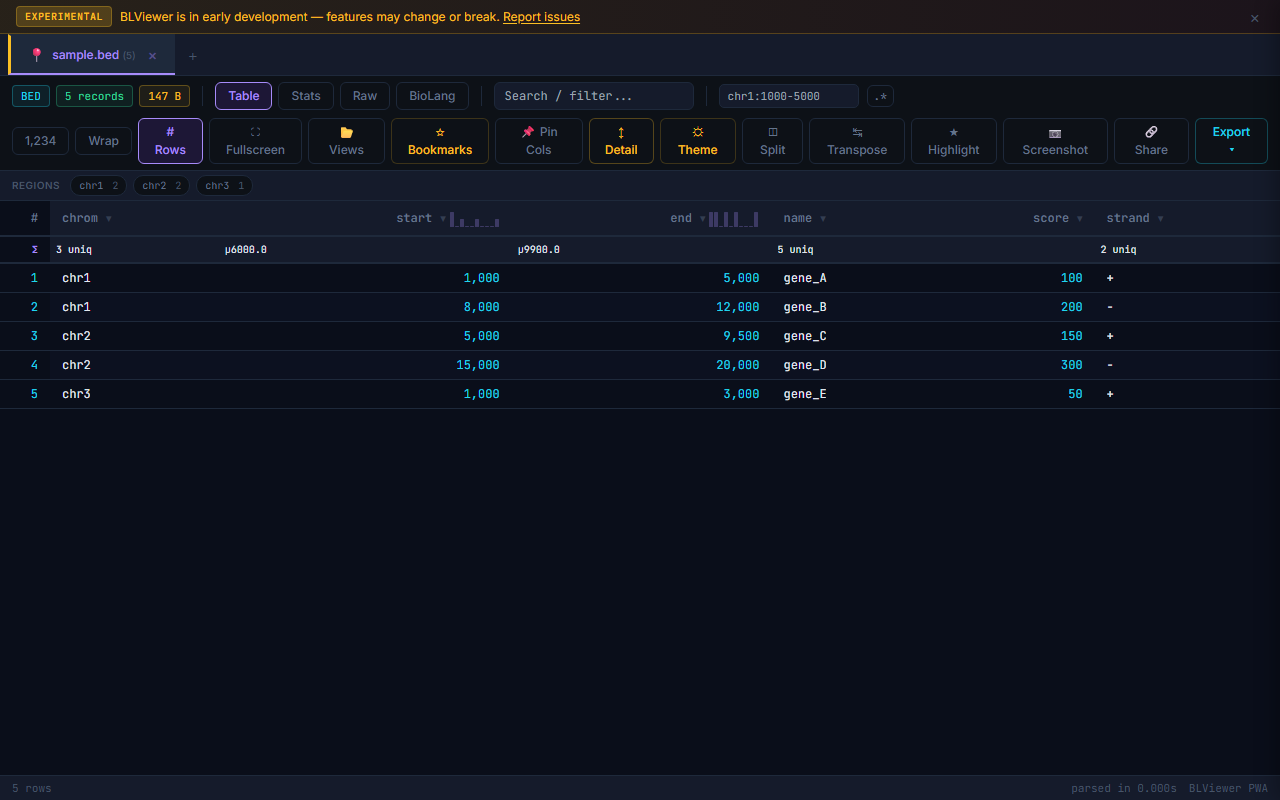
Press Ctrl+Shift+G to open the genomic coordinate search. Type a coordinate like chr1:12345 or a range like chr1:10000-20000 and press Enter. BioPeek filters the table to show only rows overlapping that region. Works with VCF, BED, GFF, and SAM files that have chromosome and position columns.
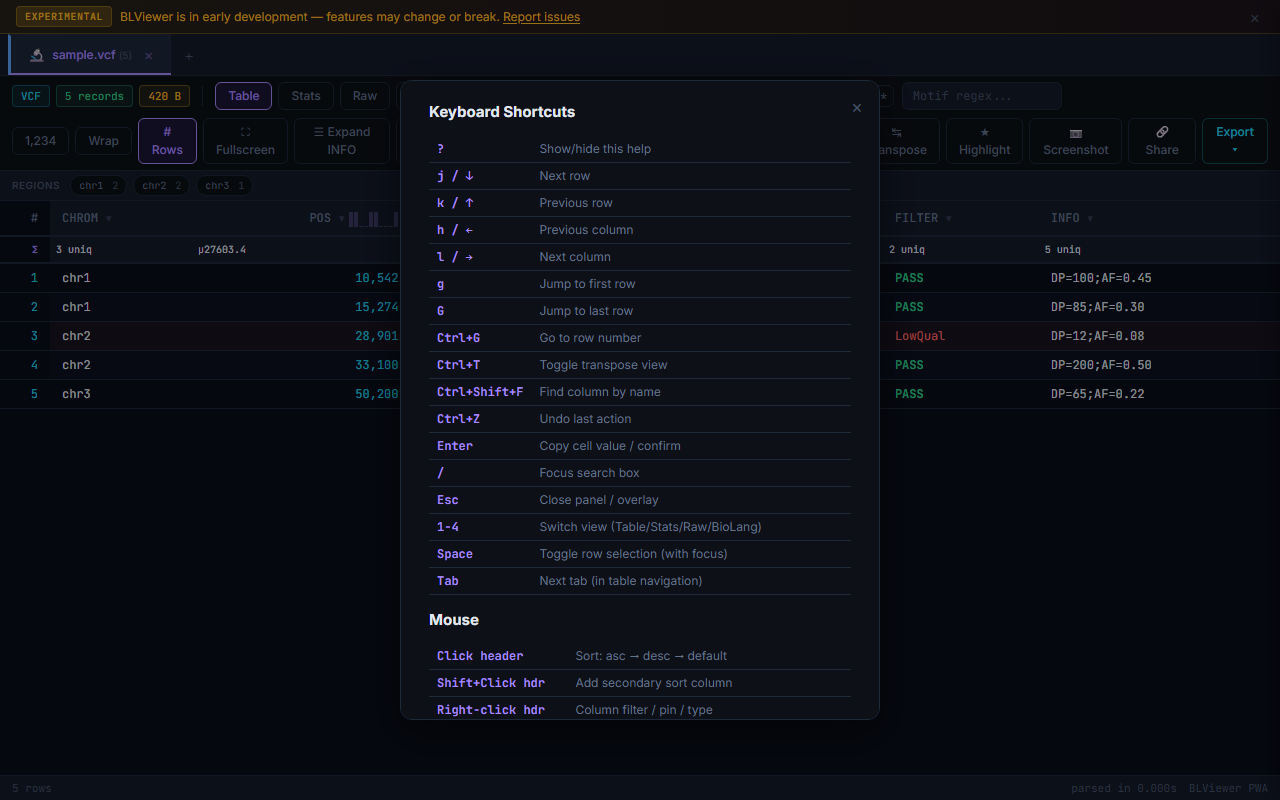
Keyboard Help Overlay
Press ? to display a keyboard shortcuts overlay listing all available hotkeys. The overlay groups shortcuts by category (navigation, selection, view modes, tools). Press Esc or ? again to dismiss.
Recent Files
The BioPeek landing page shows a list of recently opened files. Each entry displays the file name, format icon, file size, row count, and the date it was last opened. Files cached in IndexedDB show a green dot and restore instantly on click. Recent file history is stored in localStorage.
Drag-to-Group
Drag a column header to the group bar area above the table to group rows by that column's values. Grouped rows are collapsible — click the group header to expand or collapse. Group headers show the value and row count. Useful for grouping VCF variants by chromosome or BED features by strand.
Cell Editing
Double-click any cell to edit its value in place. Press Enter to confirm the edit or Esc to cancel. Each edit pushes an undo entry — press Ctrl+Z to revert. Edited cells are highlighted with a subtle border to indicate modifications.
Column Type Override
Right-click a column header and select Change Type to override the auto-detected column type. Options include text, numeric, and sequence. Changing a column to numeric enables statistical functions (min, max, mean); changing to sequence enables GC%, reverse complement, and BLAST tools.
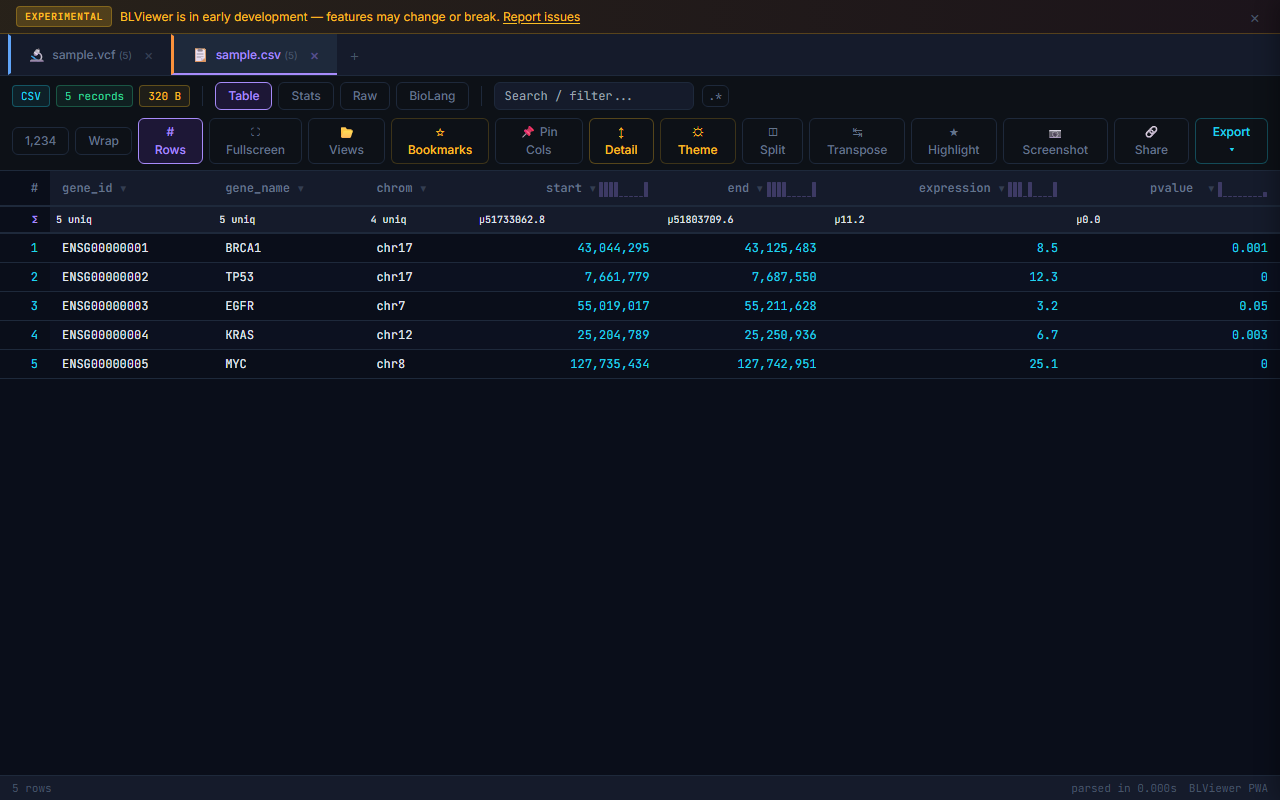
🎨 Tab Colors
File tabs are color-coded by format for quick visual identification when multiple files are open:
| Format | Tab Color |
|---|---|
| VCF | Cyan |
| FASTA | Green |
| FASTQ | Violet |
| BED | Amber |
| GFF/GTF | Pink |
| SAM | Orange |
| CSV/TSV | Slate |
Tab Tooltip
Hover over any file tab to see a tooltip with detailed file information: file size, row count, detected format, and data quality score. The quality score reflects completeness (percentage of non-empty cells) and validity (percentage of values passing format checks).
Rename Tab
Double-click a file tab to rename it. Type the new name and press Enter to confirm, or Esc to cancel. The rename is cosmetic only — it does not affect the underlying file.
Duplicate Tab
Right-click a file tab and select Duplicate to create a copy of the tab with the same data. The duplicate tab has an independent sort/filter state, so you can compare different views of the same data side by side.
▣ Fullscreen
Press F11 or click the button to toggle fullscreen mode. In fullscreen, the toolbar and navigation are hidden, giving maximum space to the table. Press F11 or Esc to exit.
Row Number Toggle
Click the button in the toolbar to show or hide the row number column. Row numbers are shown by default but can be hidden to save horizontal space on narrow screens.
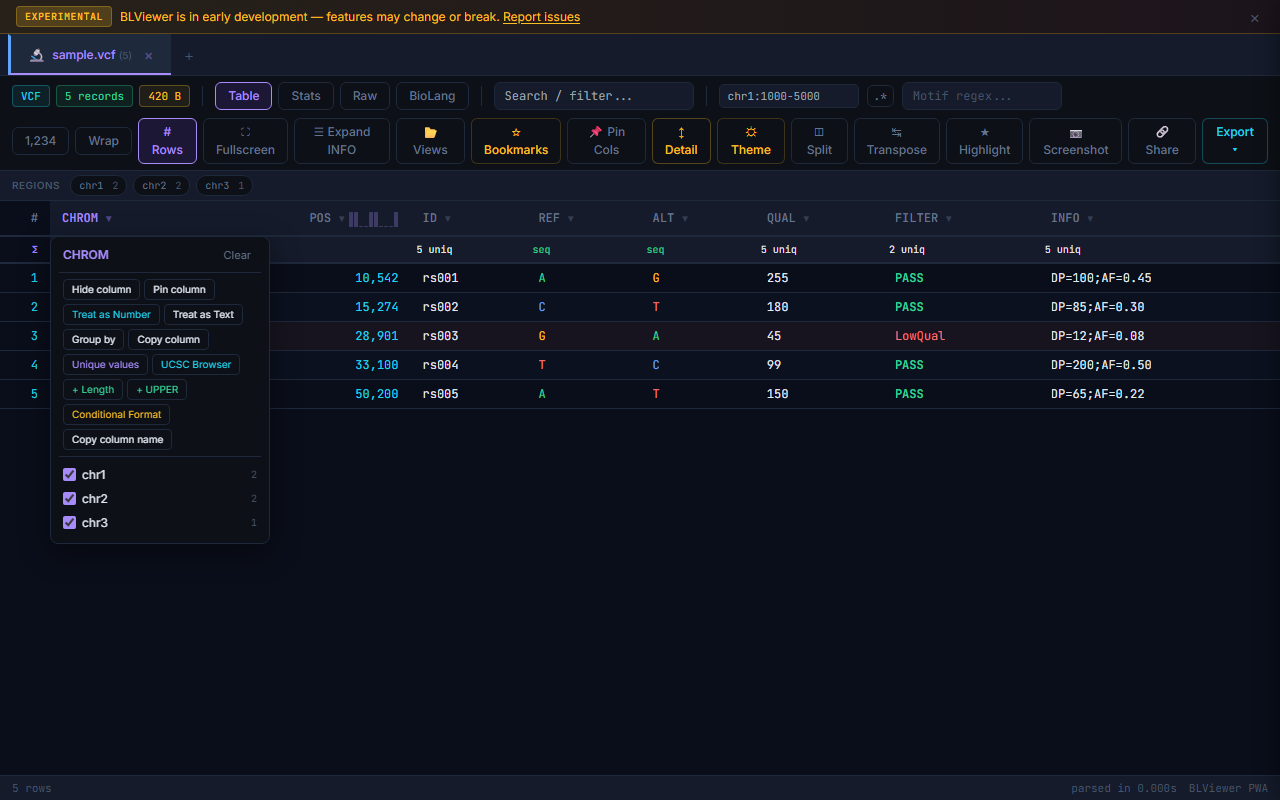
Copy Column
Right-click any column header and select Copy Column to copy all values in that column to the clipboard, one value per line. Respects any active filters — only visible rows are copied.
Unique Values
Right-click a column header and select Unique Values to see a popup listing all distinct values in the column with their frequency counts, sorted by count descending. Useful for quick data profiling.
Column Auto-fit
Double-click the column resize handle (right edge of header) to auto-fit the column width to the widest value in that column. Scans visible rows to determine optimal width.
Text Wrap
Click the toolbar button to toggle word wrapping for long text cells. When enabled, cell content wraps within the cell instead of being truncated with an ellipsis. Particularly useful for GFF attribute columns and VCF INFO fields.
Numeric Formatting
Right-click a numeric column header and select Format to choose how numbers are displayed: fixed decimal places (0–6), scientific notation, or percentage. Formatting is visual only and does not alter the underlying data. Useful for quality scores, p-values, and allele frequencies.
🏭 External Database Links
Right-click cells to open external biological databases in a new tab. BioPeek detects the data type and offers the appropriate link:
| Data Type | Database | Trigger |
|---|---|---|
| DNA/RNA sequence (≥ 10 bp) | NCBI BLAST | Right-click → "BLAST this sequence" |
| rs ID (e.g., rs12345) | dbSNP | Right-click → "Open in dbSNP" |
| Gene name (e.g., BRCA1) | GeneCards | Right-click → "Open in GeneCards" |
| Gene / variant ID | Ensembl | Right-click → "Open in Ensembl" |
Regex Search
The search box supports regular expression patterns. Type a regex pattern and matching rows are highlighted. When the pattern includes capture groups, a floating panel shows extracted matches. For example, AF=([0-9.]+) extracts allele frequency values from VCF INFO fields.
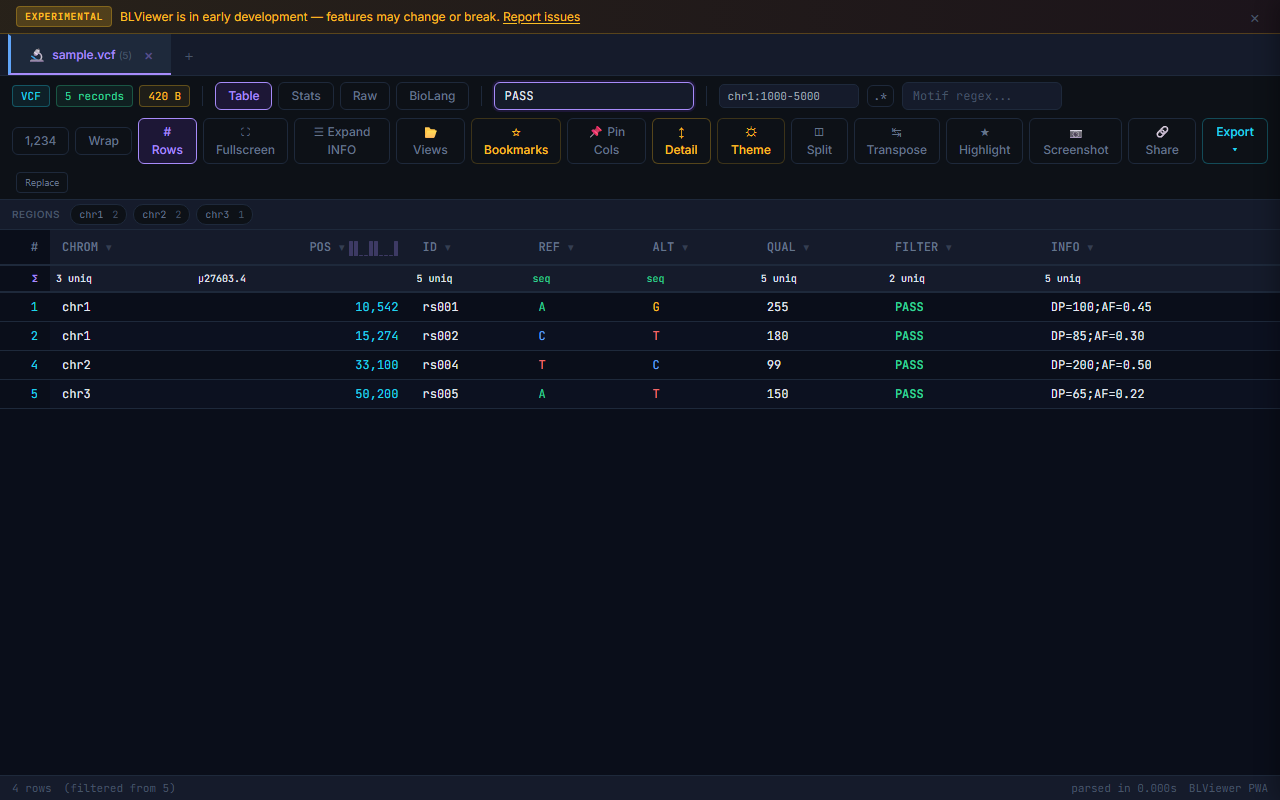
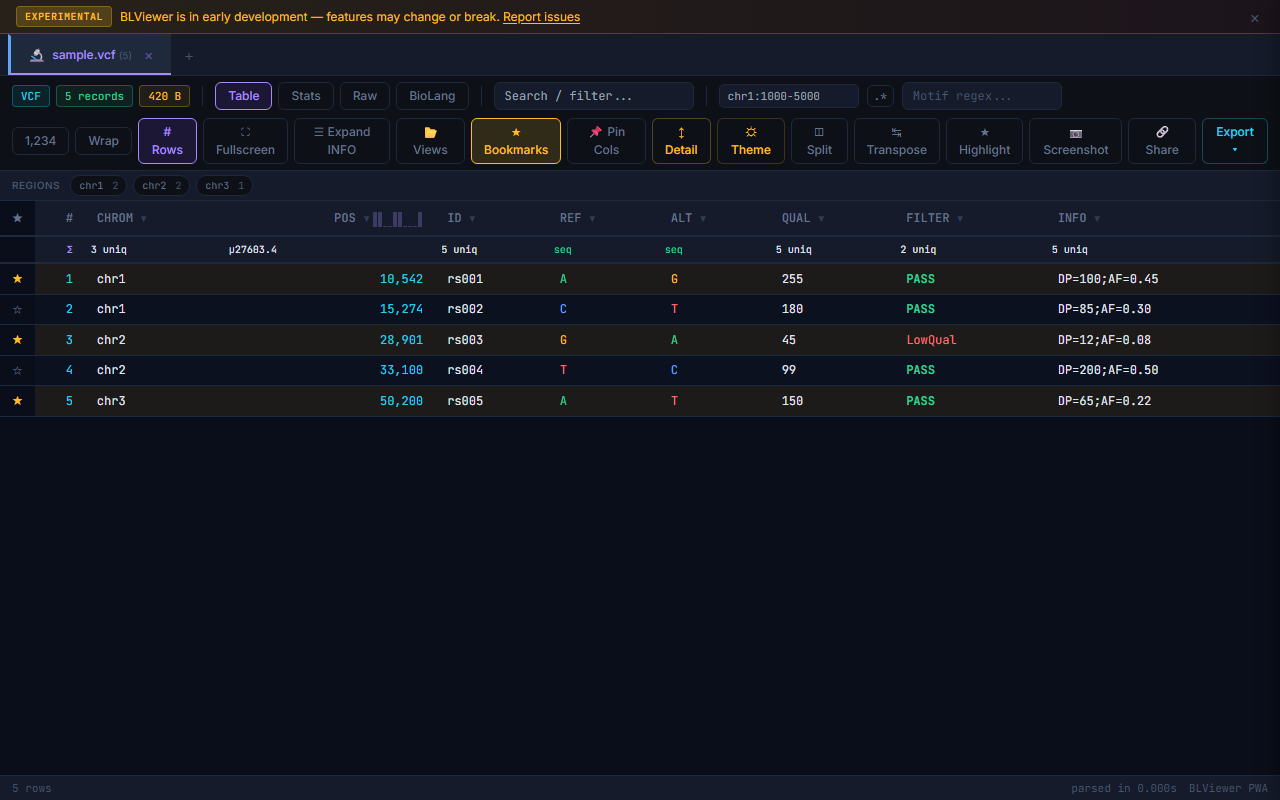
★ Bookmark Rows
Click the toolbar button to reveal a star column. Click the star icon on any row to bookmark it. Bookmarked rows persist for the session. Click the filled star (★) in the header to export only bookmarked rows. Useful for flagging variants of interest during manual review.
Export HTML
From the dropdown, select Export as HTML to save the current view as a standalone HTML file with all styling included. The exported file is self-contained (no external dependencies) and can be opened in any browser or shared via email.
◫ Split View — Dual Tab Comparison
Click when two or more files are open to enter side-by-side dual-tab comparison mode. Each pane has independent scroll, sort, and filter controls. Useful for comparing different samples or before/after filtering results.
Goto Row
Press Ctrl+G to open the "Go to Row" dialog. Enter a row number to jump directly to it. The target row is briefly highlighted after navigation. Works with both the original row numbers and filtered-view row numbers.
🎨 Conditional Formatting
Right-click a column header and select Conditional Format to color cells based on value rules. Set an operator (equals, greater than, less than, contains, between), a threshold value, and a highlight color. Multiple rules can be applied to the same column. Rules stack in order — later rules override earlier ones for the same cell.
Find & Replace
Click the toggle next to the search box to expand the find & replace bar. Type the search term and replacement value, then click Replace (single match) or Replace All. Works on text columns only — numeric columns are not modified. Each replacement pushes an undo entry.
Header Sparklines
Numeric column headers display tiny inline SVG histograms showing the value distribution at a glance. The sparkline uses 10 bins and scales to the column header width. Hover over the sparkline to see bin ranges and counts. Sparklines are automatically computed when the file is loaded.
Diff Two Rows
Select exactly 2 rows with Ctrl+click, then click the button (or the "Diff Rows" option that appears). A side-by-side comparison panel opens, with differing cell values highlighted in amber. Identical values are dimmed. Useful for comparing two variants, two sequences, or two samples.
Selection Stats in Footer
Select cells by clicking or Ctrl+clicking rows. The footer bar shows live statistics for the selected data: count, sum, average, min, and max of numeric values in the selection. Non-numeric values contribute to count only.
JSON Cell Expander
Double-click a cell that contains JSON content (detected by leading { or [) to open a formatted, syntax-colored popup. The JSON is pretty-printed with indentation. Collapsible nodes allow exploration of nested structures. Click outside or press Esc to close.
Copy Column Name
Right-click any column header and select Copy Column Name to copy the header text to the clipboard. Handy for referencing column names in BioLang scripts or other tools.
Paste to Filter
Open a column's inline filter, then paste a list of values (one per line or comma-separated) into the filter input. The column is automatically filtered to show only rows matching the pasted values. Useful for filtering by a list of gene names, variant IDs, or sample identifiers from an external source.
Undo Toast
Press Ctrl+Z to undo the last action (cell edit, find & replace, column delete, sort reset). A brief toast notification appears confirming the undo. Multiple undo levels are supported — keep pressing Ctrl+Z to step back through the history.
Data Quality Badge
Each tab tooltip includes a data quality score, shown as a percentage badge. The score is composed of two metrics:
- Completeness % — percentage of non-empty cells across all columns
- Validity % — percentage of values that pass format-specific checks (e.g., valid chromosome names, positive coordinates, parseable numbers)
GZ Decompression
BioPeek transparently decompresses .gz files using the browser's native DecompressionStream API. Drop a .vcf.gz, .fastq.gz, .bed.gz, or any gzipped bioinformatics file and it is decompressed on the fly — no server needed. The decompressed content is parsed and displayed exactly like a regular file.
Chunked Preview for Large Files
Files larger than 5 MB are loaded using chunked preview. The first chunk is parsed and displayed immediately while the rest of the file continues loading in the background. A progress indicator shows loading status. Table navigation is available as soon as the first chunk is ready, so you can start exploring without waiting for the full file.
FASTQ QC Panel
FASTQ files display a dedicated quality control panel in the Stats view with:
- Read statistics — total reads, mean/median length, min/max length
- Q30% — percentage of bases with quality score ≥ 30
- Quality histogram — SVG bar chart of per-base quality distribution
- Per-position quality — box-plot style chart showing quality across read positions
- GC content distribution — per-read GC% histogram
FASTQ Quality Heatmap Bars
In the table view, FASTQ quality strings are rendered as colored heatmap bars. Each character in the quality string is mapped to a color: green for high quality (≥ Q30), amber for medium (Q20–Q29), and red for low (< Q20). This gives instant visual feedback on per-base quality without switching to the Stats view.
VCF Variant Density Chart
VCF files show a per-chromosome variant density chart in the Stats view. Each chromosome is displayed as a horizontal bar with variant count. The chart gives an immediate overview of variant distribution across the genome. Click a chromosome bar to filter the table to that chromosome.
VCF FILTER Pie Chart
VCF Stats view includes a donut chart showing the distribution of FILTER values (PASS vs. various filter flags). Hover over segments to see counts and percentages. Click a segment to filter the table to that FILTER value. Useful for quick assessment of variant call quality.
Strand Indicators
BED and GFF files display visual strand indicators in the strand column. Plus strand (+) is shown with a right-pointing arrow in green, minus strand (-) with a left-pointing arrow in rose, and unknown strand (.) with a dot in gray. Makes strand orientation immediately visible when scanning the table.
Copy as BioLang
Right-click any table view and select "Copy as BioLang" to generate BioLang pipe code that reproduces your current view. The generated code includes the file load, any active filters, sort order, and column selection. Paste it into the BioLang console or a .bl script to reproduce the analysis programmatically.
Copy as FASTA / Copy as BED
The cell context menu includes format-aware copy options. Right-click a sequence cell and select "Copy as FASTA" to copy it wrapped with a FASTA header. Right-click a row in a genomic file and select "Copy as BED" to copy the region as a BED line. Useful for quickly extracting data for use in other tools.
URL Loading with CORS Proxy Fallback
When loading a remote file via the ?url= parameter, BioPeek first attempts a direct fetch. If the request fails due to CORS restrictions, it automatically retries through a CORS proxy. A notification indicates when the proxy fallback is used. This allows loading files from servers that do not set CORS headers, such as many FTP mirrors and institutional repositories.
PostMessage File Receive
BioPeek listens for postMessage events from other browser contexts. The BioGist extension uses this to send detected file links directly to BioPeek for visualization. Other integrations can send file content or URLs via the window.postMessage API with the message type biopeek-open.
Inline Docs Hover Tooltips
In the BioLang console (view mode 4), hovering over builtin function names shows inline documentation tooltips with the function signature, description, and a usage example. This provides quick reference without leaving the console or switching to the docs.
⚙ Streaming Full-File Stats
For files larger than 50 MB (which are truncated to the first 50 MB for table display), a button appears in the Stats view. Clicking it streams through the entire file in 8 MB chunks without loading everything into memory.
A progress bar shows streaming progress. Stats update incrementally as each chunk is processed. The final result includes total row count, column statistics, and format-specific metrics for the complete file.
Keyboard & Interaction
| Key / Action | Effect |
|---|---|
| Navigation | |
| j / k or ↑ / ↓ | Navigate table rows |
| h / l or ← / → | Navigate table columns |
| g | Jump to first row |
| G | Jump to last row |
| Ctrl+G | Go to specific row number |
| Tab | Switch to next file tab |
| View Modes | |
| 1 2 3 4 | Switch view mode: Table, Stats, Raw, BioLang |
| Ctrl+T | Toggle transpose view (rows ↔ columns) |
| F11 | Toggle fullscreen mode |
| Search & Filter | |
| / | Focus search box |
| Ctrl+K | Quick search (search box focus with command palette) |
| Ctrl+Shift+F | Find column by name |
| Ctrl+Shift+G | Genomic coordinate navigation (chr1:12345) |
| Ctrl+E | Export current view |
| Esc | Close overlay, panel, or search |
| Selection & Editing | |
| Enter | Copy cell value / confirm edit / expand row detail |
| Space | Toggle row selection |
| Ctrl+click row | Multi-select rows (summary stats in footer) |
| Ctrl+Z | Undo last action (edit, replace, sort reset) |
| Ctrl+V | Paste text as new file tab |
| Help | |
| ? | Show keyboard shortcuts overlay |
| Column Headers | |
| Click column header | Sort: ascending → descending → unsorted |
| Shift+click header | Add secondary sort column (multi-column sort with priority numbers) |
| Right-click column header | Column menu: filter, pin, copy name, copy column, unique values, change type, conditional format, numeric format |
| Double-click column header | Open column histogram sidebar |
| Double-click column resize handle | Auto-fit column width to content |
| Drag column header | Reorder columns |
| Drag column header edge | Resize column width |
| Cells & Rows | |
| Right-click cell | Context menu: copy cell, copy row, BLAST sequence, dbSNP/GeneCards/Ensembl links |
| Double-click cell | Edit cell value in-place (pushes undo) |
| Double-click JSON cell | Open formatted JSON viewer popup |
| Select text in sequence cell | Sequence tools popup (rev comp, GC%, translation) |
| Hover numeric column header | Tooltip with min, max, mean, median + sparkline |
| Double-click tab | Rename tab |
| Right-click tab | Duplicate tab |
URL Loading
Load a remote file by appending a url query parameter:
https://lang.bio/viewer.html?url=https://example.com/data.vcfThe file is fetched client-side — the server never sees your data URL. If the remote server does not set CORS headers, BioPeek automatically retries through a CORS proxy fallback.
Protocol Handler
BioPeek registers the web+bioview: protocol. Other tools and scripts can link to:
web+bioview:https://example.com/data.vcfShare Link Format
Share links encode data directly in the URL:
https://lang.bio/viewer.html?name=sample.fa&data=<base64-encoded-content>The data parameter contains the file content as base64. Maximum practical size: ~100 KB (limited by browser URL length).
PWA & Offline
- Installable — click the install prompt or use your browser's install option. Works offline after first visit.
- File Handling API — when installed as PWA, double-click .vcf, .fasta, .bed, etc. files to open directly in BioPeek
- Session restore — files under 5 MB are cached in IndexedDB. On next visit, BioPeek offers to restore your last session.
- Recent files history — the landing page shows recently opened files with format, size, row count, and time. Cached files (green dot) restore instantly.
Chrome Extension
The Chrome extension provides BioPeek directly in your browser with additional integration features:
- Context menu — right-click any link to a bioinformatics file and select "Open in BioPeek"
- Download interception — automatically offers to open downloaded bio files
- Popup quick-open — drop files or paste URLs in the extension popup
- Text selection — select sequence text on any page, right-click, "Analyze selection in BioPeek"
chrome-extension:// URLs that cannot be shared externally.
Binary File Detection
BAM, BCF, and CRAM files are binary formats that cannot be parsed in the browser text viewer. BioPeek detects these and suggests extracting regions to text formats using BioLang or samtools before viewing.
BioLang Console
The console tab loads parsed data as a BioLang Table variable named data.
Columns from the file become table columns. Powered by WebAssembly.
data |> head(5)

mean(column(data, "length"))

data |> filter(|r| r.gc > 0.5)
Large File Handling
| File Size | Behavior |
|---|---|
| < 5 MB | Full content cached in IndexedDB for session restore |
| < 10 MB | Full text kept in memory for raw view and console |
| < 50 MB | Full text parsed; raw view shows all content |
| > 50 MB | First 50 MB parsed and shown; text memory released for files > 10 MB. A "Compute full stats" button appears to stream the entire file. |
| Table view | DOM limited to 5,000 rows for scroll performance; use search/filter to narrow |
Streaming Stats for Large Files
For files larger than 50 MB, only the first 50 MB is loaded into the table view. To get accurate statistics for the entire file, click the button that appears in the Stats view.
- Streams the file in 8 MB chunks without loading the entire file into memory
- Uses Welford's online algorithm for exact mean, variance, and standard deviation
- Uses reservoir sampling (k=1000) for approximate median and percentiles
- Full exact counting for categorical value frequencies
- A progress bar shows streaming progress as each chunk is processed
- Stats update incrementally — you can see partial results while streaming continues
Version History
v1.3.0
- Protein FASTA support — Auto-detects protein sequences (
.faaor by content). Amino acids colored by physicochemical property (Zappo scheme). Protein-specific stats (top residues, composition). GC% offer suppressed for protein files. - GZ files via extension popup — Fixed: opening
.gzfiles from the extension popup or context menu no longer shows “Binary file” error. Gzipped files are now properly preserved as binary through session storage and decompressed in the viewer. - Overlay auto-cleanup — Warnings, error popups, GC% offers, and preview banners are now automatically dismissed when switching tabs, closing tabs, or loading new files. No more stale notifications from a previously viewed file.
- Large GZ handling — Compressed files over 7 MB open the viewer directly instead of attempting to pass through session storage (which has a 10 MB quota). Drop the file onto the viewer for seamless decompression.
- Responsive Display Dropdown — Toolbar toggle buttons (Color, Heatmap, Detail, Bookmarks, Pin Columns, Transpose, Highlight, Split) collapsed into a “Display” dropdown on narrow screens. Auto-expands to inline buttons on wide screens (>1200px). Active toggles show amber border and checkmarks.
- Heatmap Toggle — Global heatmap on/off from the Display menu. Auto-detects numeric columns (including string values that parse as numbers). Active toggles show amber highlight. Resets per tab.
- Sticky Summary Row — The summary row (mean/unique counts) below column headers now stays fixed while scrolling, right below the sticky header.
- Screenshot Improvements — Screenshots now include heatmap colors on numeric cells, render quality as heatmap bars (matching table view), and respect the color toggle on/off state.
- Version Update Banner — Returning users see a one-time dismissable banner after updates showing what changed, with a link to help docs.
- NCBI Sequence Fetch — Fetch FASTA sequences directly from NCBI by accession number. Supports batch fetch with multiple accessions. Tries nucleotide, protein, then UniProt databases.
- Sequence Color Toggle — Toggle nucleotide/amino acid coloring on or off from the toolbar. Setting persisted across sessions.
- GC% Sliding Window Plot — Line chart in Stats view showing GC% across a 100bp sliding window for the first sequence.
- K-mer Frequency Table — Top 20 most frequent 4-mers with count, frequency, and inline bar chart in Stats view.
- Chromosome Multi-Select — Click multiple chromosome tags to filter by several chromosomes at once.
- Large File Streaming Mode — Files larger than 10 MB activate streaming mode automatically with preview and Load All option.
- Sort & Filter Column Icons — Column headers show visible sort arrows and filter funnel icons with tooltips.
Bug Fixes
- Stack overflow on large files (
Math.min/max.applyreplaced with loop-basedsafeMin/safeMax) - Heatmap not applying on tab switch or to CSV string columns
- HTML export now includes all rows (capped at 10K for HTML, unlimited for CSV)
- Screenshot quality column showed raw ASCII instead of heatmap bars
- Race condition guards on
FileReadercallbacks - Light theme nucleotide colors too faint (darkened for white background)
- Highlight dialog now shows active rule and pre-populates values
- Toolbar chips not updating after Load All Records
- Filter cache key didn’t include Set values (stale multi-select)